8 Essential IT Metrics To Track For Software Development Project Success

The pursuit of predictably in delivering projects made tracking agile software development metrics a standard practice for many executives and dev leaders. Undoubtedly, the right software metrics can give you insight into your team’s day-to-day performance, progress towards the final deliverables, and potential bottlenecks.
Yet, development metrics are only measures. When set incorrectly, they can drive more confusion, than clarity. To help you avoid such scenarios, we have prepared this short guide, explaining how to approach software development metric selection. Let’s start with the basics.
Table of Contents
What are Software Development Metrics?
Atlassian defines IT metrics as quantifiable measurements IT leaders can use to:
- Understand the value of produced technology
- Gauge the development team performance levels
- Demonstrate the value of produced work to non-tech leaders.
In other words, the right selection of IT performance metrics for your software development project can help you:
- Bridge the communications gaps between dev leaders and business executives.
- Align your distributed teams with your organizational objectives.
- Understand whether the development process is stirred in the right direction.
- Predict future performance outcomes with higher confidence.
All of the above metrics offer benefits, which ultimately help you minimize the risks in software development.
Development Metrics: To Track or Not to Track?
On the surface level, the idea of pinning every process to an IT metric may seem sound.
However, becoming metrics-obsessed or using a “one-size-fits-all” approach to software measurement can backfire in all stages of software development.
Here’s why: every project pursues certain business goals and thus has unique complexities. That’s why you should carefully weigh in on your choice of metrics and avoid copying them from another project. Instead, you should align your metrics to your current project goals. The goal of the metrics is to help you gain instant answers to the core business questions e.g. how well is your team progressing? What’s blocking them from doing even better?
On the other hand, going too narrow with your choice of metrics isn’t an option either. Individual IT metrics have boundaries. A single metric cannot fully communicate how well your team is progressing throughout SDLC and whether the final product will meet all your expectations.
That’s why you should always opt for a combination of metrics. Based on the top CIOs’ responses, the ideal balance is 56% of metrics related to business outcomes, such as revenue growth, business margins, influencing business strategy, and 44% related to IT delivery.
To select software development metrics, take the following steps:
- Align IT metrics with project goals: The combination of your IT metrics should match your software development objectives and guide your key decisions. For instance, if you want to evaluate the severity of incidents in a project, a simple count of bugs fixed may not tell the full story.
- Limit metrics burden on the team: Measuring and analyzing irrelevant metrics can be a hindrance to actual software development. Choose metrics that can be consistently tracked, easy to analyze, and do not require your dev team to exert unnecessary efforts.
- Assess the behavior metrics may trigger: IT metrics should not direct your software development team toward the wrong incentives. For instance, by focusing your team on lines of code metrics, you may encourage them to produce more code instead of better code.
- Be mindful of the human factor: Consider the impact of development metrics on the morale of the team. Would it lead to unhealthy competition? Could it reduce the motivation to innovate and grow?
There’s nothing wrong with IT metrics changing over the course of SDLC as long as they are relevant. Drop metrics that have a negative impact on the team’s performance, can be manipulated or misused, or provide irrelevant or misleading information.
8 Examples of Software Development Metrics to Track
Every project is different. But most SDLC practices stay the same. To get a better sense of how your team progresses at different SDLC stages, you should track the following set of metrics:
Sprint Burndown
A sprint burndown metric (often presented as a chart) showcases the completion of work during the sprint against the team forecasts.
Ideally, all the forecasted items (tickets, user stories, tasks, etc.) should be completed by the end of the sprint. At Edvantis, we use Atlassian Jira to visualize sprint burndown rates during remote Sprint reviews.
By tracking sprint burndown, you can estimate whether:
- There’s enough work scheduled for each sprint (especially if the team finishes each task ahead of time).
- The team commits to an excessive amount of parallel tasks that don’t get finished on time. This results in missed deadlines.
- The total scope of work hasn’t been properly decomposed into lower-level tasks. You can notice this trend when instead of a steep reduction of remaining tasks, you see a dramatic drop.
Sprint Burndown Metrics Example:

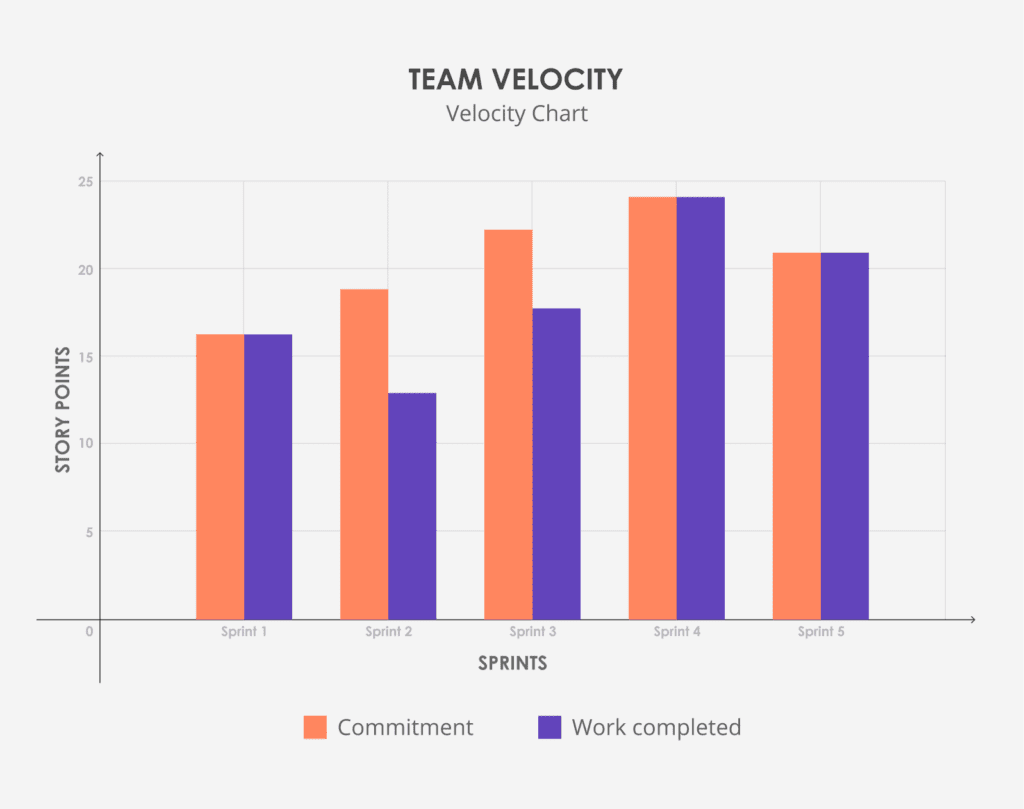
Team Velocity
Team velocity measures the average amount of work (either in story points or in hours) a team completes during a sprint.
By tracking velocity, you can estimate how quickly a team can work through the backlog and use it to forecast future estimations.
Measuring team velocity helps:
- Set realistic sprint forecasts and proper delivery expectations.
- Understand if earlier improvements were efficient. If not, investigate the reason behind that.
Important caveat: do not set the same velocity metrics for two different teams since each team works at its own pace on different sets of tasks. Comparing inter-team velocity will lead to biased results.
Team Velocity Metrics Example:
Cycle Time
Cycle time is the total time spent on a software task from the very beginning and until completion.
By knowing your team’s average speed at different stages of the development process, you can identify potential blockers early on and resolve those.
Measuring cycle time also helps:
- Set more accurate timelines
- Identify progress breakdowns
You can track and visualize your cycle time using an issue management system like Pivotal Tracker or Jira.
Cycle Time Metrics Example:

Throughput
Throughput measures the total number of work units (usually tickets, but can also include story points and cards) completed by the team over an agreed period.
This metric indicates your team capacity to deliver results over a fixed period of time.
By measuring throughput, you can also:
- Check whether the team is blocked (throughput drop)
- Plan team capacity (compare the average throughput against the current workload)
Note: Throughput has its limitations as it provides a cursory view over your team’s work dynamics. If your team could crack 7 simple user-stories last month, and only 2 complex ones this month, it does not translate to a performance drop.
Throughput Metrics Example:

Work in Progress (WIP)
WIP refers to any work that your team has committed to but not finished yet.
This metric gives you an insight on how much work is ongoing at the moment (the number of unfinished cards or work items).
By tracking WIP, you can:
- Improve the overall flow of value through your system
- Understand your team capacity and identify possible bottlenecks
You can measure WIP by using a cumulative flow diagram or simply by counting the relevant cards on your Kanban board. Tracking WIP weekly is an excellent way to understand the amount of work you have under development.
WIP Metrics Example:

Defect Density
Defect density indicates the number of defects (bugs) found per 1,000 lines of code.
Defect Density = Total Number of Defects / Total Number of Modules.
The defect density can help you:
- Measure the testing effectiveness
- Identify a module that needs changes (high defect density number)
- Point towards high-risk components
The underlying idea here is simple: the higher the defect density, the lower the code quality. Yet, this metric can be somewhat misleading since it doesn’t consider the complexity of the code. Another pitfall is that it can often be calculated wrong by indicating only the number of defects caught in one day. Defect density has a cumulative nature, and so its total number grows as the product is being developed unless you take actions to fix those defects.
Defect Density Metrics Example:

Lead Time
Lead time is an agile metric measuring the amount of time between the new task’s appearance until its completion.
To calculate it, use a simple formula:
Start time + Cycle time = Lead time.
The lead time metric is useful to:
- Evaluate changes and forecast future work
- Estimate how long can it takes for the team to get through your product backlog
- Determine the impact of any changes you make
- Assess how well your team is performing
Lead time can help you make more precise predictions on the percentage of work done during a specific period.
Lead Time Metrics Example:

Code Coverage
Code coverage is used to ensure that testing standards, established at the outset of the project, are maintained throughout the development and release cycles.
It’s a handy metric that can give you insight into the quality of your test suite.
Usually, code coverage includes function, statement, branches, condition, and line coverage metrics. So this metric can help you understand if your automated test coverage is sufficient.
However, code coverage doesn’t reflect the whole test/code quality, hence should be used together with other metrics (e.g. defect density) to show the complete picture.
The tool choice for monitoring code coverage will depend on the programming language you use. Some of the popular tools are Atlassian Clover (multi-language), Cobertura for Java, Istanbul for Javascript, SimpleCov for Ruby, and Coverage.py for Python.
Code Coverage Metrics Example:

To Conclude
When your end-goal is higher and more stable team performance, the right metrics can help you proactively monitor your project progress without resorting to micromanagement. So that you could identify and respond to potential blockers, resolve rising issues at the onset, and continuously ramp-up your team’s delivery pace.
As part of our Dedicated Team model, Edvantis consults every customer on the optimal set of IT performance metrics and supporting managerial practices to back up the delivery process. Contact us to learn more!