Data-to-Dashboard Is Built for Your Technology Stack
Choose where to run your product: cloud, hybrid, or on-premises, with no restrictions. Data-to-Dashboard is a fully tech-agnostic solution: we adapt it to the systems you already run.
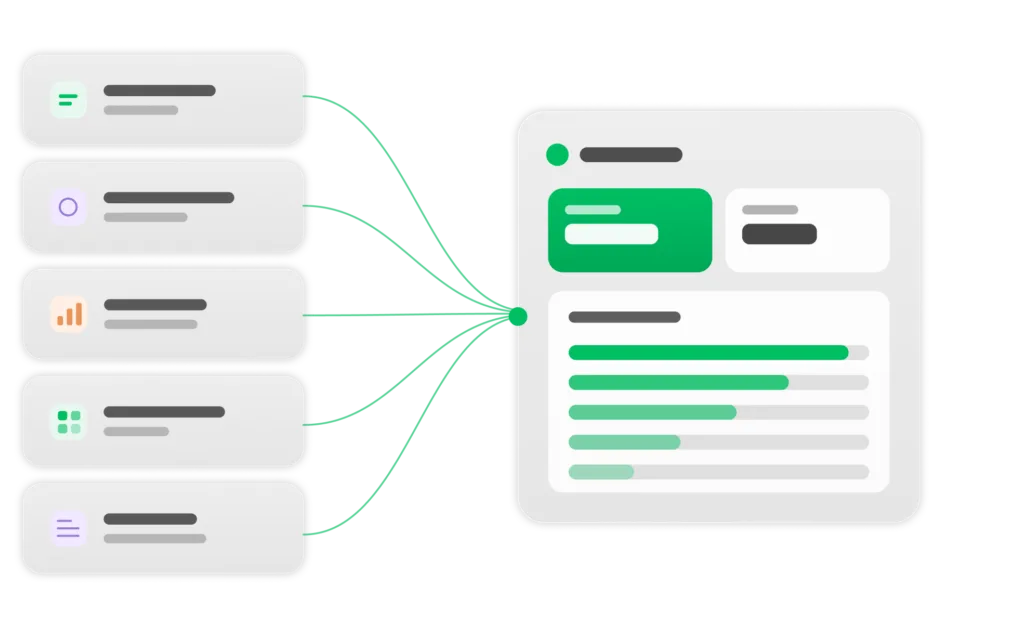
Connect fragmented business data into a self-service dashboard built around the way your company measures performance. Add optional predictive or conversational analytics layers to answer deeper questions.
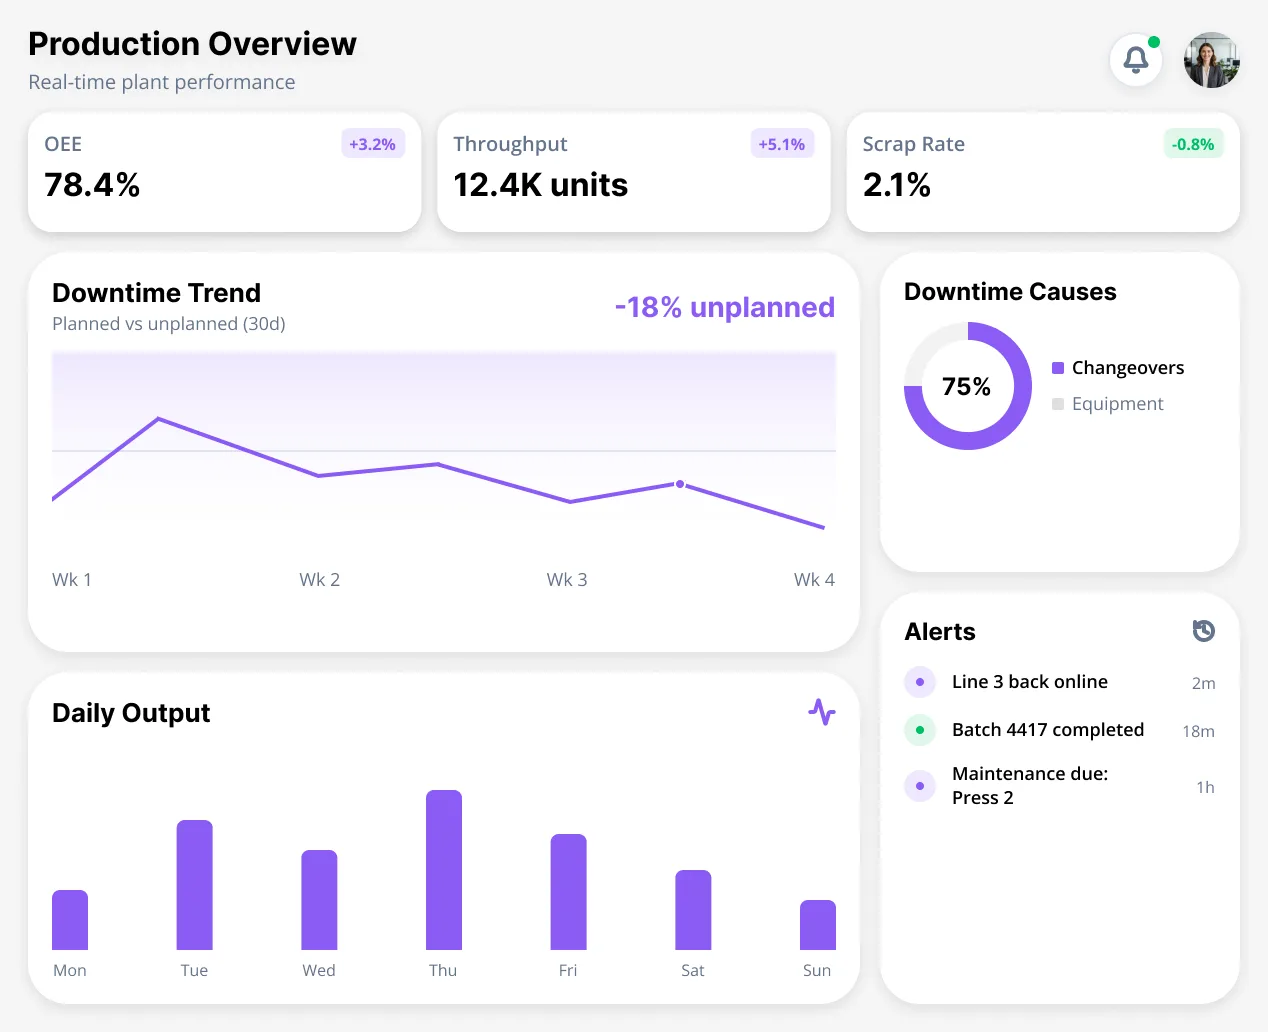
Your ERP tracks production. Your CRM holds customer data. Finance runs reports in spreadsheets. Operations uses another dashboard entirely.
So when someone asks a simple question: What’s slowing production? Which products are losing margin? Where is inventory getting stuck? The answer often takes hours of exports, reconciliations, and manual checks. Those costs cut into your profit margins.


Choose where to run your product: cloud, hybrid, or on-premises, with no restrictions. Data-to-Dashboard is a fully tech-agnostic solution: we adapt it to the systems you already run.


 Lower exit risk
Greater scalability & flexibility
Data sovereignty
Stronger governance & simpler compliance
Predictable long-term costs
Lower exit risk
Greater scalability & flexibility
Data sovereignty
Stronger governance & simpler compliance
Predictable long-term costs
A look at how we build data platforms for clients. The same engineering runs Data-to-Dashboard.
Data-to-Dashboard combines architecture assessment, data integration, and dashboard delivery in one service.
We agree on the business questions, metrics, data sources, users, and delivery priorities before development begins.
Our team reviews your current architecture, data source quality, access constraints, reporting logic, and infrastructure requirements.
Selected data gets cleansed and transformed for analytics. We build custom connectors and pipelines to support new data flows.
Dashboard with role-specific views and selected reporting features is deployed in your environment with proper access and security controls.
Each engagement is shaped around a defined decision area, reporting need, or operational priority.
 Business metric selection and alignment
Data-source assessment
Pipeline design and implementation
Deployment infrastructure setup
Permissions and access controls
Documentation and training
Data architecture audit
Data preparation and cleansing
Standard or custom connectors
Dashboard development
Deployment and handover
Business metric selection and alignment
Data-source assessment
Pipeline design and implementation
Deployment infrastructure setup
Permissions and access controls
Documentation and training
Data architecture audit
Data preparation and cleansing
Standard or custom connectors
Dashboard development
Deployment and handover
 Natural-language data access
Advanced data exports
Data migration
Predictive analytics
Additional data domains
Ad hoc managed support work
Natural-language data access
Advanced data exports
Data migration
Predictive analytics
Additional data domains
Ad hoc managed support work
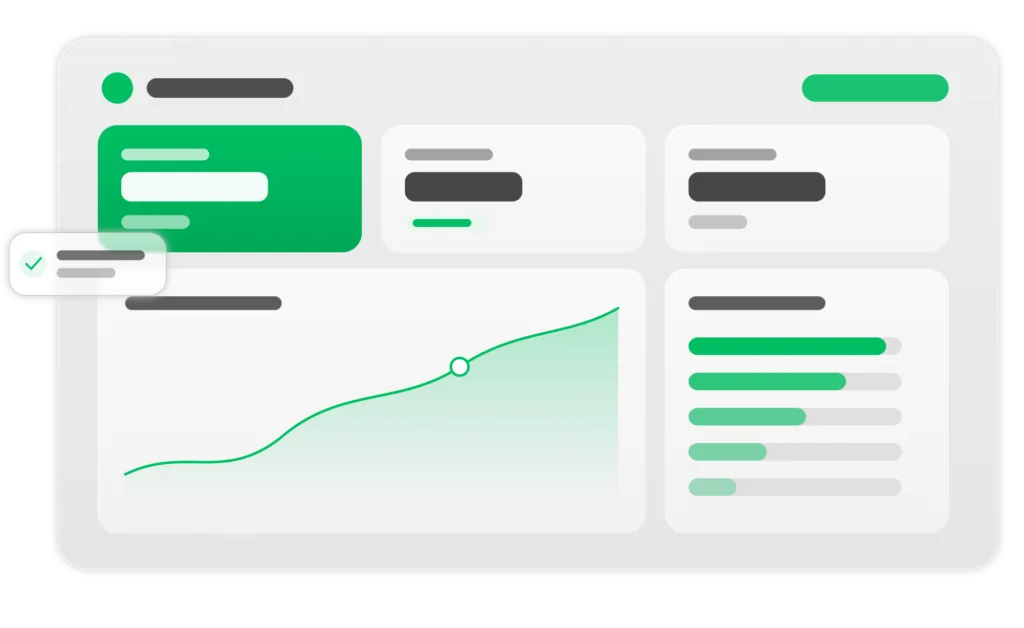
Start with the questions your teams need answered, rather than the limits of a prebuilt BI view. Combine data from any relevant domain and build views around the metrics your teams need the most.


Add deeper analytics on the same foundation. Extend your environment with conversational access to data, predictive models, automated alerts, or AI-ready data preparation as your reporting needs evolve.


Get the flexibility of custom analytics without an open-ended consulting engagement or a permanent platform subscription. Data-to-Dashboard gives you a defined implementation, faster delivery, and full ownership of the deployed solution.
|
Data-to-Dashboard
|
Managed analytics platforms
|
Traditional BI consultancies
|
|
|---|---|---|---|
| Deployment |
Your infrastructure
|
Vendor-hosted
|
Depends on engagement
|
| Reporting experience |
Your metrics and logic
|
Standard data model
|
Custom, often open-ended
|
| Data model flexibility |
Any reporting views your data supports
|
Constrained by predefined schemas
|
Flexible, scope-dependent
|
| Time to first value |
4 to 6 weeks
|
8 to 16 weeks
|
4 to 12 weeks
|
| Scalability |
On-demand work packages
|
Subscription expansion
|
Additional phases
|
| Handover |
Full handover included
|
Vendor keeps the platform
|
Varies by contract
|
| Advanced analytics path |
ML and chat on the same foundation
|
Depends on roadmap and tier
|
Separate projects
|
| Exit flexibility |
You own everything
|
Complex migration out
|
Depends on contract terms
|
| Best starting point |
One bounded decision area
|
Standardized use cases
|
Broad transformation programs
|
Data-to-Dashboard is built for mid-sized manufacturers that need faster answers from existing systems, without adding another rigid analytics platform.

Submit the form or write to us directly. Within one business day you’ll hear from someone who works on Data-to-Dashboard implementations. Tell us which decision area you’d start with, and we’ll come back with questions worth discussing.

Write an email
engagement@edvantis.com




Yes. We design each Data-to-Dashboard to slot with your existing stack, using standard or custom connectors where needed. Plus, we help with data transformation to ensure proper data loading and correct rendering on analytics dashboards.
No problems. We always run a data audit first to assess the data quality. Then clean, transform, and prepare the sources needed for the agreed dashboard scope before development moves ahead.
Absolutely. The scope of the first deployment is focused on one use case, so you get value faster. But the same foundation can be extended later with new data sources, additional dashboards for extra roles or plant sites, forecasting, predictive models, alerts, or conversational analytics.
The metrics and views are for you to select. We create each dashboard around your metric definitions, reporting logic, user roles, and decision needs rather than forcing you into a fixed data model.
We’ll demo the product to you and provide user training if needed. From there, you can keep the first scope as-is or expand it. Additional data domains, dashboards, forecasting, predictive models, and conversational analytics can be added through follow-on work packages.
Power BI and Tableau are BI tools: someone still has to connect the data, model it, and build the reporting on top. Data-to-Dashboard is that work, productized. We connect your data, apply your business logic, build the reporting layer, deploy it in your environment, and hand over the finished solution. Most of the value is in the data foundation underneath, so if you already use Power BI or another BI tool, we can build the foundation and deliver the dashboards in it.
You get a more predictable outcome within a fixed timeline. The first engagement follows a defined delivery process, agreed scope, and clear timeline, while still leaving room to customize the data model, metrics, and dashboard around your business.
Pricing depends on the number of data sources, the scope of the first dashboard, and the deployment environment. After the scoping call you get a fixed quote for the agreed scope, with any third-party licensing or cloud costs identified separately, so there are no hidden fees.
That depends on the stack you choose. Any licensing, infrastructure, or usage-based costs are identified during solution design and kept visible from the start, so you know what sits outside the Edvantis implementation fee.
Yes! We’ll be delighted to walk you through a dashboard tailored around your business metrics and use case, so you can see how Data-to-Dashboard would work. You can book a demo meeting via the form above.